
Why Your Dashboard Hashrate Looks Lower Than the ASIC Spec Sheet
Spec sheets quote nominal hashrate at a reference inlet temperature and a fresh firmware profile; a live dashboard reports a share-based estimate of what your machine actually submitted in the last few minutes. The gap is usually between 5% and 15%, and it is real money: a 2 PH/s site producing 0.000897212 BTC — $75.99 gross a day at a BTC price of $84,692 — loses about $7.32 of net daily income for every 10% of nominal hashrate it cannot deliver.

Key takeaways
- Dashboard hashrate is a rolling estimate from accepted shares, so a window of minutes will always read below a spec sheet that describes a perfect ten-second burst.
- Rejections of 1–3% come off the top before any fee: at 2 PH/s, three points of rejected work is roughly $2.28 a day.
- Inlet temperature is the largest controllable derate. A 10% hashrate loss on a 2 PH/s site is about $7.32 of net income per day, against a power bill that barely moves.
- Reconcile against net, not nominal: at 2 PH/s the listed 4% fee on the PPS-settled block-reward component is worth about $3.04 a day on its own.[1]
Definitions first
Three different numbers get called "hashrate". Nominal hashrate is the manufacturer's claim, measured on a bench at a stated inlet temperature with the firmware of the day. Effective hashrate is what the hash boards actually compute at your site, in your ambient conditions, on your power quality. Pool-reported hashrate is a statistical estimate: the pool counts accepted shares over a window and divides by the share difficulty, so it lags the machine by the length of that window and it only counts work it accepted.
That last distinction explains most of the confusion. A pool watching a five-minute window will report a number that dips every time a machine restarts, every time a job supersedes a share in flight, and every time rejections tick up. None of those events mean the silicon got slower. Conversely, a smooth reading from a long averaging window can hide a machine that has been throttling for days.
The trade-off nobody prices
Nobody chooses a derated machine, but almost everybody chooses the conditions that produce one. Higher density per rack means warmer air reaching the next machine; a cheaper cooling setpoint means a bigger temperature delta between the spec sheet's reference and reality; a lower power cap buys PSU headroom and HVAC savings at the cost of hashrate. Every one of those decisions trades compute for something else, and the exchange rate is rarely written down.
| Gap source | Typical size | Where it shows up |
|---|---|---|
| Rolling share window | a few percent and highly variable | Pool dashboard only, recovers on its own |
| Rejected and stale shares | 1–3% on a well-run site | Pool dashboard; never paid |
| Inlet temperature above reference | 5–12% | Firmware log and pool dashboard agree |
| Power cap or low-power firmware mode | 5–20% by design | Both views, stable, intentional |
| PSU and conversion losses | 3–8% at the wall | Electricity meter, not the dashboard |
| Restarts and stratum reconnects | minutes per event | Fresh hashrate ramps and uptime gaps |
Read the table as a list of levers rather than excuses. Rejections are an engineering problem with a network answer; temperature is a facilities problem with a layout answer; power mode is a business decision that should be made with an electricity price and a coin price in front of you.
Example with two setups
Take ten machines rated 200 TH/s each, 2 PH/s nominal at 20 J/TH, deployed two ways. Setup A sits in a hall with a 35 °C inlet and derates 10%, delivering 1.8 PH/s. Setup B sits in a hall holding a 25 °C inlet and delivers the full 2 PH/s.
Setup A produces about 0.000807492 BTC a day, $68.37 gross and roughly $65.63 after the listed 4% fee on the block-reward component. Setup B produces 0.000897212 BTC, $75.99 gross and about $72.95 net. The electricity bill is nearly identical in both cases: 40 kW of draw at 20 J/TH is 960 kWh a day, about $57.60 at $0.06/kWh. That leaves Setup A with $8.03 a day of margin and Setup B with $15.35 — a difference of $7.32 a day, or roughly $219.60 over a month, from nothing but the air the machines breathe.
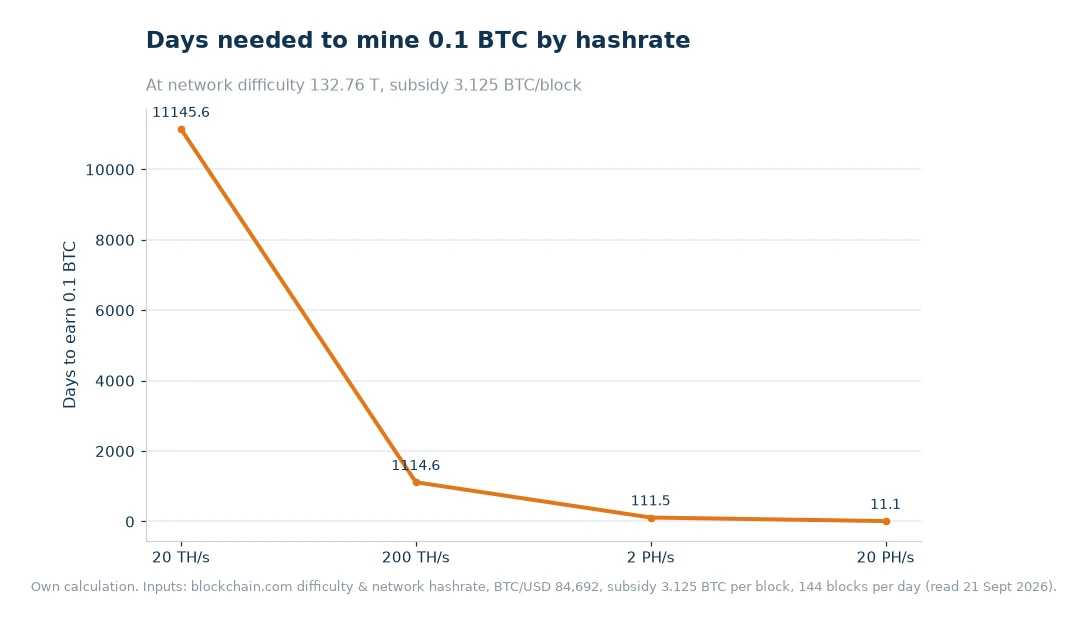
Notice how far the target is at small scale. A single 20 TH/s machine takes about 11,145 days to produce 0.1 BTC at today's difficulty, while a 20 PH/s farm needs about 11 days. Derates do not care about scale — they are a percentage — but the absolute value of the same percentage point scales linearly with hashrate, which is why facilities engineering deserves attention exactly when a farm gets big enough for the numbers to matter.
Practical next steps
- Measure the inlet, not the room. A thermometer at head height in an aisle reads cooler than the air entering the front of the top rack. Log the worst case, since that is the machine that derates first.
- Separate the three numbers. Write nominal, effective and pool-reported hashrate side by side per model, so you can attribute a shortfall instead of arguing about it.
- Quantify the derate in money. Run the effective hashrate through the income calculator and compare with the nominal figure; the delta in dollars per day is what cooling improvements buy back.
- Check efficiency at the wall, not at the board. J/TH figures quoted per board ignore PSU losses, and those losses are paid for at your tariff.
- Compare against the fleet. A miner profitability ranking shows which models still clear their running cost at current price and difficulty; a model that cannot should be retired rather than cooled harder.
- Watch the pool's own numbers. Pool and network hashrate on the mining statistics page let you separate a network-wide difficulty shift from a problem in your own hall.
- Attribute deltas correctly. When you change cooling or firmware, check the pool-reported figure on the ViaBTC KAS Mining Pool state page a day later, which gives the rolling window time to settle.
Frequently asked questions
Do mining pools cost anything to join?
Joining is free; the pool earns from its fee on settled payouts, which appears as a percentage of the block-reward and transaction-fee components. That means the pool's cut is proportional to delivered hashrate, so a derated machine pays a proportionally smaller fee as well as earning less.
Can I mine more than one coin at the same time?
Yes. Merged mining lets a machine secure a parent chain and an auxiliary chain together, and multi-coin pools support switching between chains without moving hardware. On a dashboard, that can look like a hashrate shortfall if only one chain's workers were counted in the view you are reading.
Should I overclock to close the gap?
Usually not. Overclocking recovers nominal hashrate at the cost of stability, and instability appears as invalid shares plus a rising hardware-error count — a loss that is harder to notice than a steady derate. Fixing inlet temperature is the safer lever, and it does not shorten hardware life.
Measure first, then spend
Log inlet temperature, reject rate and pool-reported hashrate per model for one week before changing anything. In most halls the biggest single contributor is obvious once those three columns sit next to each other, and it is usually cheaper to fix than the second and third combined. Rebuild the comparison monthly, because a derate that creeps in with the seasons is invisible in any single snapshot.
Data and sources: ViaBTC fee schedule and payout methods[1], ViaBTC earnings calculator[2]. Network difficulty 132.76 T, network hashrate, the 3.125 BTC block subsidy, 144 blocks per day and a BTC price of $84,692 were read from public chain data and market feeds on 21 September 2026. Derate percentages are illustrative and depend on site conditions.